A Comprehensive Review of Lunar Remote Sensing Methods in the Thermal, Mid, and Far-Infrared Spectrum
1. Introduction to Thermal and Infrared Remote Sensing
Visible and near-infrared (VNIR) reflectance spectroscopy has historically served as a foundational technique for mapping planetary surfaces, but it possesses inherent limitations when identifying primary rock-forming silicates (Nash et al., 1993). Certain key framework minerals, such as pure crystalline plagioclase feldspars and quartz, lack active transition metals (such as Fe2+ or Ti3+) within shorter wavelengths, causing them to remain mostly featureless in VNIR spectra (Nash et al., 1993).
To overcome these diagnostic constraints, remote sensing methodologies utilize the thermal infrared region—encompassing mid-infrared (mid-IR), long-wave infrared (LWIR), and far-infrared (far-IR) wavelengths from 4 to 40 μm—to capture fundamental molecular and lattice vibrations (Ciazela et al., 2024; Nash et al., 1993). This spectrum provides a highly sensitive framework to map planetary mineralogy, evaluate crustal rock types, and identify indigenous resources from orbit (Ciazela et al., 2024; Kumari et al., 2025; Nash et al., 1993). Beyond bulk silicate composition, thermal parameters are frequently integrated into multi-sensor planetary models evaluating volatile distribution, cold-trapping mechanisms, and surface properties across airless bodies like the Moon and Mercury (Nozette et al., 2001).
2. Silicate Differentiation via the Christiansen Feature (CF)
Mid-IR diagnostic remote sensing relies on the physical property that planetary surface materials emit thermal radiation governed directly by their underlying molecular structure, lattice geometry, and inter-atomic force constants (Nash et al., 1993). A primary spectral landmark within this regime is the Christiansen Feature (CF), a prominent emission maximum and reflectance minimum located near the 8 μm boundary (Allen et al., 2012).
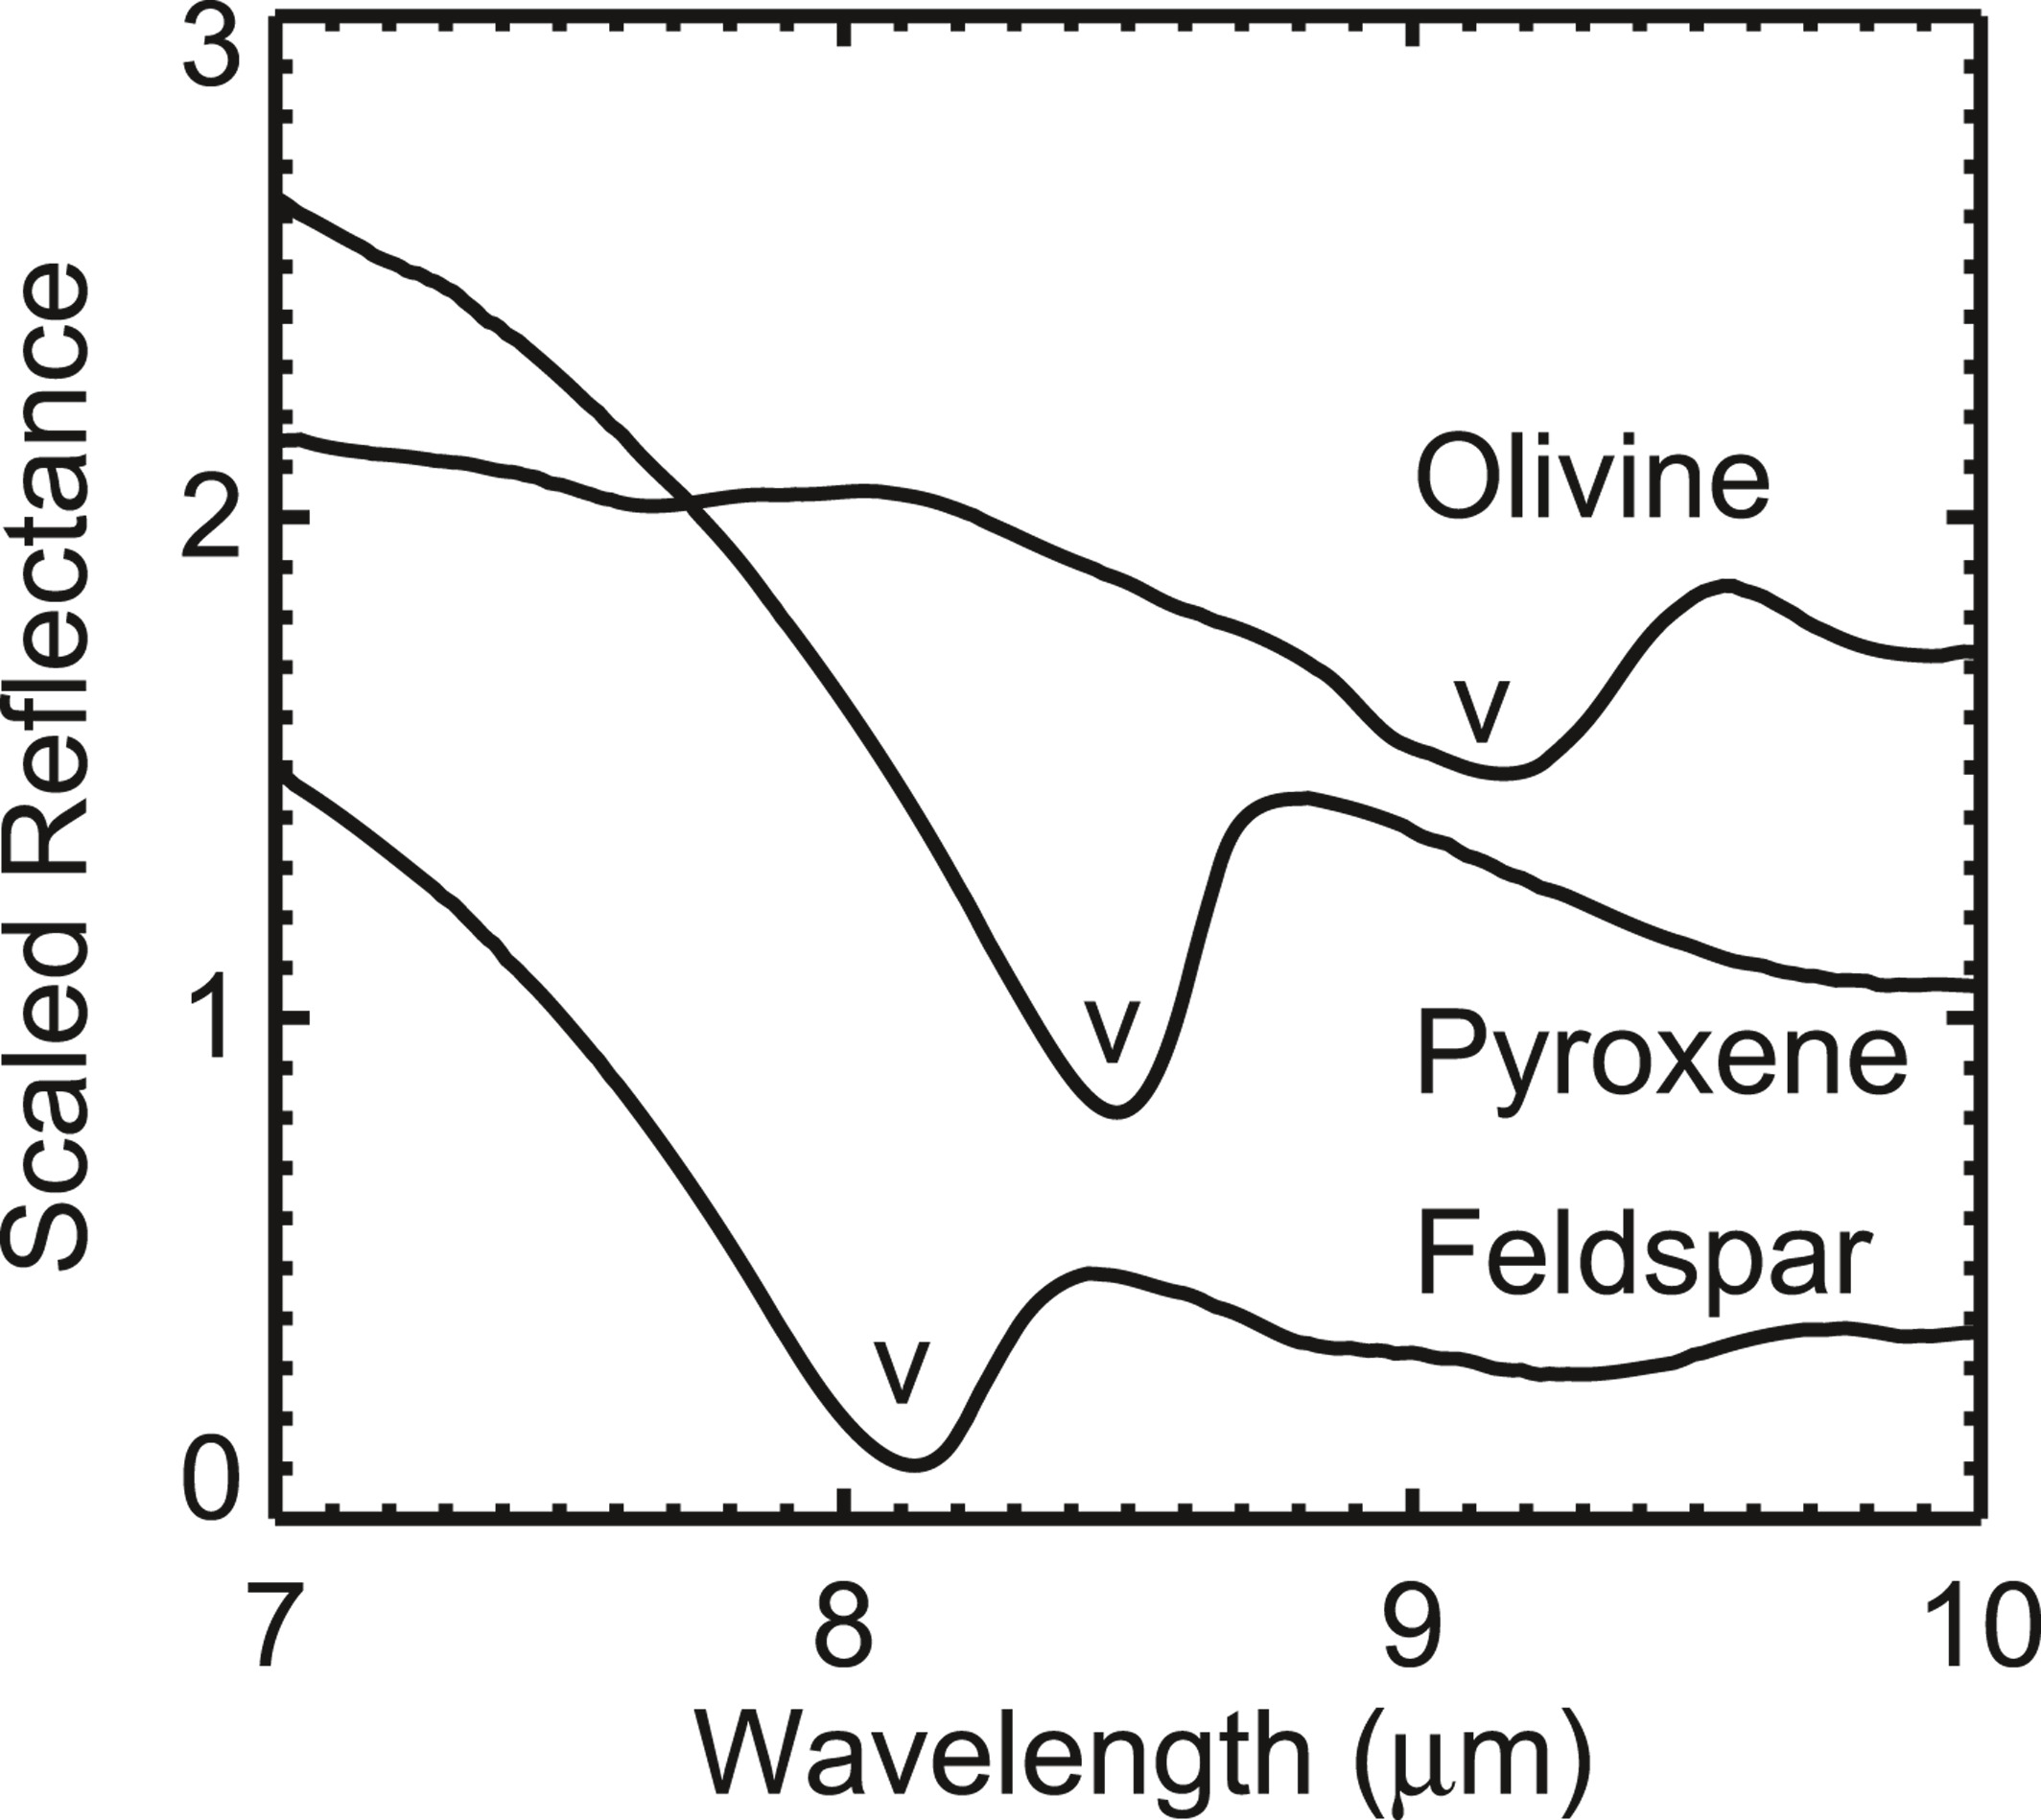
- Polymerization Shifts: The precise wavelength position of the CF tracks the degree of silicate polymerization, which shifts systematically according to the abundance of major framework cations like iron (Fe) and magnesium (Mg) (Allen et al., 2012). This property has enabled global tracking and mapping of relatively silica-rich (silicic) and silica-poor (ultramafic) lithologies on the Moon (Kumari et al., 2025).
- Environmental Sensitivities: While the CF is highly sensitive to bulk composition, detailed laboratory simulations demonstrate that its wavelength position is also influenced by secondary physical parameters, including regolith particle size, surface albedo, soil porosity, local temperature variations, and ambient space environmental conditions (Kumari et al., 2025).
- Reststrahlen and Transparency Features: Located longward of the CF, fundamental Si-O stretching and bending vibrations create intense Reststrahlen bands that discriminate between major mineral phases like olivine, pyroxene, and plagioclase, while transparency features emerging around 12 to 15 μm indicate fine-fraction regolith particle size properties (Nash et al., 1993).
3. Resource Mapping and the Far-Infrared (FIR) Frontier
While mid-IR silicates define bulk crustal geology, recent methodological advancements have pushed remote sensing into the far-infrared (far-IR) range spanning 20–40 μm to address resource exploration and In-Situ Resource Utilization (ISRU) requirements (Ciazela et al., 2024).
- Ore Mineral Absorption Peaks: Vital lunar ore minerals, such as sulfides (pyrite, troilite) and oxides (ilmenite), exhibit highly prominent, narrow absorption peaks in the 20–40 μm range (Ciazela et al., 2024). These diagnostic features are significantly stronger than the spectral traits of common silicate, carbonate, or sulfate minerals in the same bands (Ciazela et al., 2024).
- Linear Unmixing and Detection Thresholds: Orbital simulations utilizing linear spectral unmixing models indicate that regolith surfaces containing a minimum of 10% to 20% ore concentrations (such as pyrite mixed into a silicate matrix) can be clearly discerned from orbit within this FIR window (Ciazela et al., 2024). This provides an exploration tool to identify metallic deposits necessary for infrastructure, solar panel production, and oxygen extraction (Ciazela et al., 2024).
4. The Thermal Radiance Correction Challenge in Hydration Mapping
Interpreting spectral features near the transition between standard reflectance and thermal emission (the 3 μm region) introduces significant radiative transfer complexities (Chauhan, 2021). The 3 μm band is highly sought after as it captures absorption from hydroxyl (OH) groups and molecular water (H2O) attached to the lunar regolith (Chauhan, 2021).
- Thermal Background Overlap: In non-polar lunar regions, intense solar illumination drives daytime surface temperatures well above 300 K (Chauhan, 2021). At these temperatures, a strong component of thermally emitted radiance leaks into the observed spectra at wavelengths beyond 2.5 μm (Chauhan, 2021).
- Diviner-Aided Inversion: To isolate true surface solar reflectance and evaluate hydration signatures from orbital spectrometers like the Moon Mineralogy Mapper (M3), processing algorithms must perform a rigorous thermal correction (Chauhan, 2021). This requires integrating realistic daytime surface temperature profiles derived from the mid-IR channels of the Diviner Lunar Radiometer Experiment to mathematically model and subtract the emitted thermal background (Chauhan, 2021).
5. Instrumentation Profiles: Spaceborne Radiometers and Spectrometers
The evolution of mid- and far-IR remote sensing has culminated in highly specialized orbital instrument profiles designed to execute these inversion models:
- Diviner Lunar Radiometer Experiment: Deployed onboard the Lunar Reconnaissance Orbiter (LRO), this multi-channel system captures three distinct thermal channels near 8 μm to track the shifting Christiansen feature, mapping global composition and regional dark mantle pyroclastic flows (Allen et al., 2012).
- Next-Generation Thermal Mappers: To enhance chemical mapping precision, current and upcoming payloads employ refined filter functions to map extreme compositions from orbit (Kumari et al., 2025). These configurations include the Lunar Thermal Mapper (LTM) onboard the Lunar Trailblazer smallsat mission, alongside specialized systems like LCIRiS and LVISE (Kumari et al., 2025).
- MIRORES (Multiplanetary Far-IR ORE Spectrometer): Proposed as a lightweight architecture (<10 kg) suitable for microsatellite integration, this instrument utilizes a high-resolution Cassegrain optical assembly to sample radiation across eight narrow far-IR bands (each 0.3 μm wide) (Ciazela et al., 2024). It centers up to five channels directly on ore mineral absorption marks (e.g., 24.3, 24.9, 27.6, 34.2, and 38.8 μm) to detect localized fields of pyrite, marcasite, chalcopyrite, ilmenite, and troilite down to a spatial resolution of less than 5 meters from a 50 km orbit (Ciazela et al., 2024).
6. Quantitative Chemometric Processing Pipelines
Rather than relying purely on simple visual inspection of individual bands, modern remote sensing data pipelines integrate chemometric unmixing algorithms to handle complex multi-wavelength matrices (Li, 2006). Algorithms such as Partial Least Squares (PLS) Regression and Principal Component Regression (PCR) are applied directly to thermal and hyperspectral datasets (Li, 2006). PLS modeling is widely preferred because it successfully reduces errors when mapping absolute bulk oxide concentrations and major mineral abundances using fewer extracted independent components, establishing a scalable tool for automated global geological mapping (Li, 2006).
References
- Allen, C. C., Greenhagen, B. T., Donaldson Hanna, K. L., & Paige, D. A. (2012). Analysis of lunar pyroclastic deposit FeO abundances by LRO Diviner. Journal of Geophysical Research: Planets, 117(E00H28). https://doi.org/10.1029/2011JE003982
- Prakash Chauhan, Mamta Chauhan, Prabhakar A. Verma, Supriya Sharma, Satadru Bhattacharya, Aditya Kumar Dagar, Amitabh, Abhishek N. Patil, Ajay Kumar Parashar, Ankush Kumar, Nilesh Desai, Ritu Karidhal and A. S. Kiran Kumar. (2021). Unambiguous detection of OH and H₂O on the Moon from Chandrayaan-2 Imaging Infrared Spectrometer reflectance data using 3 μm hydration feature. Current Science,121 (3), 391-401. https://www.jstor.org/stable/27310612
- Ciazela, J., Bakala, J., Kowalinski, M., Pieterek, B., Steslicki, M., Ciazela, M., Paslawski, G., Zalewska, N., Sterczewski, L., Szaforz, Z., Jozefowicz, M., Marciniak, D., Fitt, M., Sniadkowski, A., Rataj, M., & Mrozek, T. (2024). Lunar ore geology and feasibility of ore mineral detection using a far-IR spectrometer. Frontiers in Earth Science, 11, 1190825. https://doi.org/10.3389/feart.2023.1190825
- Kumari, N., Breitenfeld, L. B., Shirley, K., & Glotch, T. D. (2025). Characterizing extreme compositions on the Moon using thermal infrared spectroscopy. Frontiers in Astronomy and Space Sciences, 12, e1696995. https://doi.org/10.3389/fspas.2025.1696995
- Li, L. (2006). Partial least squares modeling to quantify lunar soil composition with hyperspectral reflectance measurements. Journal of Geophysical Research: Planets, 111(E04002). https://doi.org/10.1029/2005JE002599
- Nash, D. B., Salisbury, J. W., Conel, J. E., Lucey, P. G., & Christensen, P. R. (1993). Evaluation of infrared emission spectroscopy for mapping the Moon's surface composition from orbit. Journal of Geophysical Research, 98(E12), 23535–23552. https://doi.org/10.1029/93JE02434
- Nozette, S., Lichtenberg, C., Spudis, P. D., Bonner, R., Bussey, D. B. J., & Robinson, M. S. (2001). Integration of lunar polar remote‐sensing data sets: Evidence for ice deposits on Mercury and the Moon. Journal of Geophysical Research: Planets, 106(E10), 23253–23258. https://doi.org/10.1029/2000JE001417